|
SETI@home ©s│║”b¦õ©Ūż░╗“ĪH
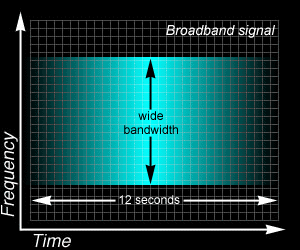
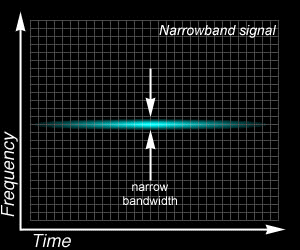
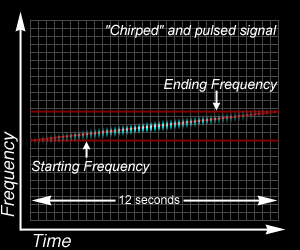
”ėĄLĮu╣q▒µ╗Ę├Ķ®ę▒Ą”¼¬║░TĖ╣ĪA∙žŁ▒®|”│ż@©Ū”]»└ź▓ČĘź[źH┐ļ├čĪB▒Ų░ŻĪF”p”a¬Ēź╗©Ł®ę┤▓«g¬║╣q║Ž¬iĪBżH│yĮ├¼P│q░T╣q¬i....ĄźĪA│o©Ūźč”a▓yź╗©Ł®ę┤▓«g¬║ĄLĮu╣q░TĖ╣ĪAżŻČ╚”│Ą█ż@®w¬║▒j½ūĪAźBĘ|żŻ┬_”a▓Żź═ĪCźtż@Łė”]»└ĪA Arecibo ĄLĮu╣q▒µ╗Ę├Ķ¼Oż@Łė®T®w®¾”aŁ▒¬║żj½¼ĄLĮu╣q▒Ą”¼│]│ŲĪAżŻ»Ó¦’┼▄▒Ą”¼ź§©żĪA®ęźHź”ĄL¬k╣’ź¶ż@¼P©t¦@┬Ļ®w░l┬▄ĪF”ėźBżŻ┬_║}▓Š¬║¼P¬┼ĪA©Ž▒µ╗Ę├Ķ¬║Īu├Ķ└YĪvĄJ┬Iż]żŻ┬_”a”b¼P¬┼żż▓Š░╩Ą█ĪCźž╝ą¬½ČiżJĪu├Ķ└YĪv║╩Ą°Įd│“©ņ┬„Č}║╩Ą°Įd│“ĪAźu”│ 12 ¼Ē¬║«╔ČĪĪC”]”╣ĪA¦┌Ł╠źu”n░▓│]ĪA”b▒µ╗Ę├ĶĪu├Ķ└YĪv║╩Ą°Įd│“¬║ 12 ¼Ēż¦żżĪAĪuź~¼PżHĪv┤Ļź®ĄoźX▒j½ū░„żj¬║░TĖ╣ĪAż~»Ó│Q¦┌Ł╠”¼©ņĪC░č╗P¬╠®ę”¼©ņ¬║©CŁė Work-UnitĪA│Ż¼O│s─“ 100 ¼Ē®ę▒Ą”¼¬║ĖĻ«ŲĪA©CŁė Work-Unit ®╝”╣│Ż”│żp│Īź„Ł½┼|ĪA”p”╣ĪA┤N»ÓĮT½OżŻĘ|”│ź¶”¾ż@ŁėŁ½Łn¬║├÷┴õ░TĖ╣”]Īuż┴│╬Īv”ė║|źóĪC
See the section on RFI (Radio Frequency Interference) for more details.
Extra Credit Section: More detail on the analysis
SETI@home Ą{”Ī╣’ĘL«z░TĖ╣¬║Ęj┤M»ÓżOĪAż± Arecibo ▒Ą”¼»Ė®ę▒─ź╬¬║ SERENDIP IV │n┼ķĄ{”ĪŁn░¬źXżQŁ┐ĪF│o¼O”]¼░ SETI@home Ą{”Ī®ę▒─ź╬¬║¼Oż@║žĘź¼░┴cĮŲŁp║Ō¬║║t║Ō¬k - ĪuCoherent IntegrationĪvĪFźž½e┴┘©S”│╣qĖŻ│]│Ų”│źRż└»ÓżOźi└│źI│o║ž╝ŲŠŪ╣B║ŌżĶ”ĪĪCźtż@żĶŁ▒ĪA½h╣’ĖĻ«Ų¦@¦ų│tĘ┴ź▀ĖŁ┬Ó┤½ (Fast Fourier Transforms) ĪA┬Ū”╣”b▓V”XĄ█żŻ”P└W▓vĪB└W╝e╗P¼█▓Š▓v¬║ĄLĮu╣q¬iżżĪA¦õźX░¬▒j½ū░TĖ╣©├ź[źH░O┐²ĪC░č╗P¬╠źč SETI@home ”°¬AŠ╣®ę”¼©ņ¬║ Work-UnitĪA¼ę¼OźHżWŁz©BŲJ¦@│B▓zĪC
│o╝╦┴┘©S¦╣®OĪA¦┌Ł╠ź▓ČĘźH©õź”└W╝e”AČi”µ└╦¼dĪI¦┌Ł╠▒N└╦¼d«pŁ╚▒j½ū¬║└W╝eź[Ł┐©ņ 0.15 HzĪA¼█▓Š│B▓zĮd│“ż]”P©Bź[Ł┐”© ĪV10 Hz/Sec ”▄ +10 Hz/SecĪC┴÷ĄM└╦┤·Įd│“¼O½eż@©BŲJ¬║ 2 Ł┐ĪA”²╣Ļ╗┌żWĪA╣B║Ō┴`Čqźu”│½eż@©BŲJ¬║żGż└ż¦ż@ĪA¼∙źŅźaĖU”Ė╣B║Ō░╩¦@ĪC
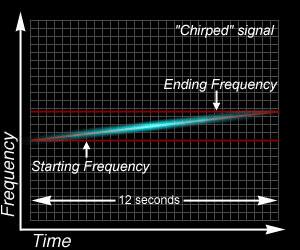
│╠½ßĪA▒q▓V┬°Ą█”U║ž└W▓vĪB└W╝e╗P¼█▓Š░TĖ╣¬║ĄLĮu╣q¬iżżĪA¬ņ©B▒o©ņ¬║░¬▒j½ū«pŁ╚╣q¬iĪAź▓ČĘ”AČi”µĪużHżu░TĖ╣żz┬Z¦P┬_┤·ĖšĪvĪCźu”│”b 12 ¼Ē«╔ČĪĮd│“ż║ĪA©õ░TĖ╣▒j½ū”│Īuź²╗╝╝WĪB½ß╗╝┤ŅĪv¬║▒Ī¦╬ ( 12 ¼Ē¼░¼P¬┼®T®wźž╝ą│q╣L▒µ╗Ę├ĶĪu├Ķ└YĪv¬║«╔ČĪĪA”ėĘĒźž╝ą│q╣LĪu├Ķ└YĪv«╔ĪA▒Ą”¼ż¦░TĖ╣▒j½ū”█ĄMĘ|▓Żź═Īuź²╗╝╝WĪB½ß╗╝┤ŅĪv¬║▓{ČH)ĪA│oŁė░TĖ╣ż~Ę|│Q”CżJĪuźi»Ó©ė”█ź~¼PżÕ®·Īv©├ź[źH”ęČqĪC
Finding pulsed signals
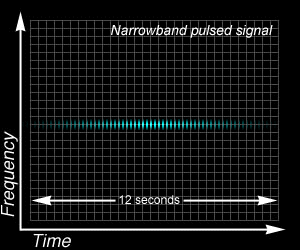
All the above work is done just to find a continuous extraterrestrial signal - one that's "always on", or an intense pulses. What if our alien friends are trying to signal us with a series of regularly spaced pulses? That means that we must also look for a signal that regularly varies in power over time. SETI@home applies two different tests. One of these tests looks for pulse triplets that are relatively strong. The other test looks for lots of equally spaced, but weak pulses.
The triplet test is pretty simple. For every frequency slice in the spectrum, the computer looks for pulses above a certain threshold value. This threshold is set at a reasonable value so as to reveal a reasonable number of pulses, yet not overwhelm us with noise that would cause us useless calculation. For every pair of pulses above the threshold, the screensaver looks for a pulse exactly in between the two. If it finds one, the screensaver logs it and sends the data back to Berkeley. The screen saver does this intelligently, so that it does not repeat itself in trying ALL pairs. Remember that it must do this for EVERY frequency slice in your 10kHz sample!
The second pulse detection method is a little more complicated. It was developed specially by the SETI@home team just for this purpose. It's called a "fast folding algorithm." Again we do this analysis on every frequency slice in your 10kHz piece of data. This method was designed to detect lots of small repeating pulses in the data. These small pulses may be weak enough to seem lost in the noise and be undetectable. We start by selecting a frequency slice from the data set to examine. We now look at this power vs. time data for the pulses. The screensaver slices up the data into uniform sized time chunks and adds the chunks all together. If the size of the time chunk is the same as (or a multiple of) the period of the pulses, all the pulses will add one on top of the other and we will see the pulses grow out of the noise. The hard part here is that we must guess the correct size for the time slice. Since we have no idea what the frequency of the pulses might be, we have to try ALL the various time periods. Again, the algorithm does this in such a way that it will not repeat work already done. If repeating pulses are found, they are logged and sent back to Berkeley.
How long should all these computations take?
An average, current model home home computer
should take between 10 and 50 hours to complete one work-unit.
This assumes that the computer ONLY works on SETI@home.
Depending on how the telescope was moving when the work unit was recorded, your computer will do between 2.4 trillion and 3.8 trillion mathematical operations (flops or floating point operations in technical jargon) to complete its work.
ż└¬Rż@Łėżu¦@│µ”ņĪAż@»ļ¬║╣qĖŻ©s│║Łn¬ßČO”hżų«╔ČĪĪHŁY╣qĖŻ”b«╔ČĪż║źuź╬®¾░§”µ SETI@home Ą{”ĪĪA▒`©Ż¬║«aź╬Š„½¼¼∙ 10 ©ņ 50 żp«╔ĪC
▓{”bĪAżj«a└│Ėė®·┴AĪA¼░”¾ SETI@home ╗▌Łnżj«aż@░_©ė└░”ŻĪI
|


